The Most Affordable and Most-Expensive Places to Buy in London

Marketing No Comments

The property market has boomed over the past year, thanks to the stamp duty holiday which has given a lot of first-time buyers the opportunity to get their foot on […]

Read More

The property market has boomed over the past year, thanks to the stamp duty holiday which has given a lot of first-time buyers the opportunity to get their foot on the property ladder. Coupled with the introduction of the new government backed 5 per cent deposit scheme, designed to help home buyers, the market isn’t showing any signs of slowing down just yet.

New analysis of London’s property prices by Ellis & Co, shows the areas of the city that are the most affordable for home buyers looking to buy something of their own. The research also revealed the most expensive areas of London to purchase a home, with average property prices in these areas almost reaching £2m.

The top 10 most affordable areas to buy a property in London:

table –>

London Postcode Areas covered Average property price
SE28 Thamesmead £275,194
N9 Lower Edmonton £324,420
N18 Upper Edmonton £325,352
SE2 Abbey Wood £330,345
SE25 South Norwood £348,701
E6 East Ham, Beckton £350,124
SE18 Plumstead, Woolwich £351,089
SE20 Anerley, Penge £380,445
E13 Plaistow £382,300

table –>

The quiet residential area of Thamesmead is the most affordable area in London to buy a property. A home in the postcode area of SE28 has an average price of £275,194, almost £50,000 cheaper than the next most affordable area of Lower Edmonton.

To find out more about how we can assist you with your Mortgage requirements, please click here to get in touch

Southeast London is home to five of the top ten most affordable areas in London to buy a home, all coming in under £381,000. This means, under the new 5% deposit scheme, home buyers are able to get their foot on the property ladder in London with a deposit of as little as £13,759.

The top 10 most expensive areas to buy a property in London:

table –>

London Postcode Areas covered Average property price
W8 Kensington £1,949,475
W1 Marylebone, Mayfair, Soho £1,820,143
WC2 Covent Garden, Holborn, Strand £1,667,871
SW3 Brompton, Chelsea £1,634,116
SW7 South Kensington £1,528,409
W11 Holland Park, Notting Hill £1,446,853
SW1 Belgravia, Pimlico, Westminster £1,295,609
SW13 Balham £1,189,849
NW3 Hampstead, Swiss Cottage £1,137,545
NW8 St John’s Wood £1,112,247

table –>

Eight of the top ten most expensive areas of London are located in the West and South West, with the average property price in these areas coming in at £1.56 million. Two postcodes in North West London have made the top ten, with St John’s Wood, Hampstead and Swiss Cottage having average property prices above £1 million.

In addition to uncovering the most affordable and most expensive areas to buy in London, Ellis & Co looked at some of the best areas to invest for those looking for the best up and coming areas, tenant demand or the locations with the best schools.

Read about the UK Housing Market via our Specialist Residential & Buy to Let Division

Best up and coming area for property: Tottenham

Tottenham is one of the top ten most affordable areas in London to buy, with the average property price coming in at just over £400,000. As well as new homes being built and Tottenham Hotspur FC’s impressive new stadium, the area is currently in the early stages of a 20-year regeneration plan. Taking into account the changes in the area and plans for the future, it looks like it is set to be the best up and coming place for properties in London.

Best area to invest in property: Willesden Green

This area is hugely popular with renters making it a great place to invest in property, for those looking to be a landlord or expand their portfolio. Demand for rental properties is high in this North West borough and rental income returns a yield of 3.6 per cent. In addition, house prices have grown by 26 per cent in the area since April 2020, and this strong growth looks set to continue. Whilst it might not be the cheapest area to buy a property, with the average property costing around £457,000, it is a highly sought-after area for young professional renters, so investors could see a healthy long-term return.

Best area for schools: Harrow

Harrow could be the best place to buy a new home if having access to great schools is high on the priority list for families. The area is home to 16 schools rated “Outstanding”, giving parents plenty to choose from, including both state and private options. Some of the highly rated schools in the area include Belmont, Marlborough, and Whitmore High. The average property price in the area is £460,408, which is more affordable than many other areas of London.

BY PETE CARVILL

Source: Property Wire

Discover our Mortgage Broker services.

The Best Areas in London for Buy-to-Let Yields This Year

Marketing No Comments

Buy to Let – Since the onset of COVID-19, investors have turned away from many of the asset classes whose presumed security and capacity for long-term value creation were once […]

Read More

Buy to Let – Since the onset of COVID-19, investors have turned away from many of the asset classes whose presumed security and capacity for long-term value creation were once thought unimpeachable. With international lockdowns accelerating existing trends towards flexible working practices and e-commerce, investors have seen billions wiped off the value of commercial property assets.

However, while commercial property has suffered, the value of residential assets has fared well during the pandemic. Thanks to the extended stamp duty holiday, the sales market is buoyant and price growth has exceeded expectations, while a surprisingly robust lettings market benefited from permission to continue operating during later lockdowns and a flurry of activity as renters seek out housing that more closely aligns with their post-COVID priorities.

At Home Made, we have analysed data from thousands of property listings across London to create an up-to-date guide on buy-to-let rental yields for investors in the capital. Here are the top 10 postcodes in London offering investors the best rental yields for 1, 2, and 3-bedroom properties.

To find out more about how we can assist you with your Mortgage requirements, please click here to get in touch

1-bedroom properties

list {“ordered”:true} –>

  1. IG11 (Barking, Upney) – 6.12 per cent
  2. N9 (Lower Edmonton) – 5.89 per cent
  3. TW13 (Feltham, Twickenham) – 5.65 per cent
  4. EN8 (Cheshunt, Waltham Cross) – 5.57 per cent
  5. IG1 (Ilford) – 5.56 per cent
  6. EN3 (Enfield) – 5.50 per cent
  7. RM6 (Chadwell Heath, Goodmayes, Marks Gate, Little Heath) – 5.46 per cent
  8. RM1 (Romford) – 5.43 per cent
  9. RM7 (Romford, Dagenham, Hornchurch) – 5.39 per cent
  10. IG2 (Gants Hill, Newbury Park, Aldborough Hatch) – 5.35 per cent

list –>

2-bedroom properties

list {“ordered”:true} –>

  1. UB1 (Southall) – 5.93 per cent
  2. IG11 (Barking, Upney) – 5.64 per cent
  3. EN3 (Enfield) – 5.52 per cent
  4. RM6 (Chadwell Heath, Goodmayes, Marks Gate, Little Heath) – 5.48 per cent
  5. N9 (Lower Edmonton) – 5.42 per cent
  6. TW5 (Hounslow) – 5.39 per cent
  7. N18 (Upper Edmonton) – 5.39 per cent
  8. IG1 (Ilford) – 5.37 per cent
  9. IG3 (Ilford, Cransbrook, Loxford) – 5.35 per cent
  10. RM1 (Romford) – 5.33 per cent

list –>

3-bedroom properties

list {“ordered”:true} –>

  1. RM8 (Dagenham, Beacontree) – 5.13 per cent
  2. RM9 (Dagenham, Beacontree) – 5.01 per cent
  3. RM10 (Dagenham, Beacontree) – 4.90 per cent
  4. IG11 (Barking, Upney) – 4.80 per cent
  5. EN3 (Enfield) – 4.76 per cent
  6. RM3 (Harold Wood, Harold Hill) – 4.64 per cent
  7. N9 (Lower Edmonton) – 4.61 per cent
  8. CR0 (Croydon) – 4.56 per cent
  9. N18 (Upper Edmonton) – 4.54 per cent
  10. CR7 (Thornton Heath) – 4.54 per cent

list –>

Overall

list {“ordered”:true} –>

  1. IG11 (Barking, Upney) – 5.13 per cent
  2. RM10 (Dagenham, Becontree) – 4.97 per cent
  3. RM9 (Dagenham, Becontree, Castle Green) – 4.94 per cent
  4. RM8 (Dagenham, Becontree, Becontree Heath, Chadwell Heath) – 4.91 per cent
  5. SE28 (Thamesmead, Greenwich, Bexley) – 4.88 per cent
  6. E13 (Plaistow, West Ham) – 4.59 per cent
  7. RM3 (Harold Wood, Harold Hill, Noak Hill, Harold Park) – 4.54 per cent
  8. N9 (Lower Edmonton) – 4.44 per cent
  9. E6 (East Ham, Beckton, Barking) – 4.40 per cent
  10. RM6 (Chadwell Heath, Marks Gate, Little Heath, Goodmayes) – 4.35 per cent

list –>

Discover our Buy to Let Mortgage Broker services.

What does the data show and why?

As the data indicates, the most attractive investment prospects right now are mainly clustered in London’s outermost Eastern boroughs: Barking and Dagenham, Redbridge, and Havering. A review of our previous yields analysis (published in late 2019) suggests that there has been a sustained eastwards shift in the location of postcodes offering the best potential ROI for buy-to-let landlords.

There are several likely reasons why this is the case, with trends established both before and during the pandemic responsible for the continuing eastwards shift.

Improvements to transport infrastructure

As was the case in our original 2019 analysis, improvements to London’s transport infrastructure mean that residents in high-yield areas can commute into the major economic hubs of the city centre with relative ease. The forthcoming Elizabeth line will drastically improve transport connections between many of this year’s best performing locations to the rest of the TfL network, with stations opening in Ilford, Goodmayes, Chadwell Heath, and Romford. We know that rental prices react more quickly than sales values to infrastructural improvements, so investors should expect to see an even greater spike in rental yield value in these East London suburbs.

The impact of urban redevelopment

Urban redevelopment schemes that introduce thousands of units of high-specification housing and modern amenities tend to change the profile of tenants, making them more attractive to working professionals on higher incomes. This increases the value of nearby property, leading to a sustained rise in rental yields over the medium term as rental price growth outpaces the growth in sales prices.

East London’s outer boroughs are currently further behind in their redevelopment journey than many of the more central neighbourhoods that have already been transformed by various urban renewal projects (e.g Stratford, Royal Docks). Ambitious redevelopment plans underway in the East, particularly in Havering, are set to have a similar impact, and investors should expect to see consistent growth in rental yields along with significant appreciation in the sales value of any property.

Consumer and renter behaviour

Tenant migration patterns have been altered significantly by COVID-19. Since the onset of the pandemic, the widespread adoption of flexible working practices has meant that renters have had more freedom to move across the city without as much concern for the impact on their daily commute. When we analysed enquiry data for rental properties in TfL travel zones 4, 5, and 6, we found that 40 per cent of the renters enquiring on properties in these areas were currently based in zones 1, 2, and 3, suggesting a significant spike in the number of tenants moving towards London’s suburbs. Similarly, 64 per cent of the renters logged in our database in 2020 were moving to a completely new area of the city, with an average travel time of 44 minutes between their previous property and prospective new home.

As well as having the flexibility to stray further away from the workplace, tenant priorities have changed drastically following our collective experiences of successive lockdowns. The so-called ‘race for space’ is well documented, with many tenants moving to the suburbs or leaving the city altogether in search of larger properties with more access to green space and better suited to pet ownership – features which are now a higher priority for many than proximity to the workplace.

Many have also moved further away from the centre to reduce costs during a period of sustained economic upheaval. For many of London’s working professionals, it no longer makes financial sense to pay a premium for expensive central property when there is no need to maintain a daily physical presence in the workplace. Properties in high-yield areas are able to satisfy both the post-COVID lifestyle priorities and affordability criteria of London’s renters.

Overall, the residential lettings market has proven remarkably adaptable when faced with unprecedented economic and social circumstances, along with various existing trends that disrupt the way people rent and let property. As a result, buy to let rental yields in outer zones have remained high, and even increased in the last 18 months, as renters expanded their search radius to include the new areas that they would now consider living in.

BY PETE CARVILL

Source: Property Wire

Discover our Mortgage Broker services.

The Kent towns where sold prices spiked the highest during lockdown

Marketing No Comments

House prices have seen record rises between March 2020 and 2021, according to new data from the Office for National Statistics. In spite of worries about the economy and the […]

Read More

House prices have seen record rises between March 2020 and 2021, according to new data from the Office for National Statistics.

In spite of worries about the economy and the housing market since the onset of the global pandemic, property prices in Kent and the UK more broadly have remained strong.

Overall, our county has seen substantial rises, whilst the picturesque Tunbridge Wells has seen prices rocket by the most locally in the past year.

In March 2020, the average house price in Tunbridge Wells was £377,298, but by March 2021, it had jumped by 10.5 per cent – or £39,768 – to £417,066.

In other parts of Kent, prices were also up.

In Folkestone and Hythe, average prices rose by 12.9 per cent, or £33,491, to £293,076 at the end of March.

Meanwhile there was a 13.7 per cent rise in Thanet, an increase of £32,004 to £265,517.

To find out more about how we can assist you with your Mortgage requirements, please click here to get in touch

Canterbury and Dover also saw large proportional spikes, rising by 10.7 per cent and 11.5 per cent respectively.

Compared to the rate of real wage growth, calculated by subtracting the rate of inflation from wage increases, this is even more significant – as during the pandemic, wages rose by just 2.8 per cent on average.

Across Kent as a whole, prices have risen by 8.8 per cent – or £25,647 – in the past year to an average of £317,251.

This means that house prices in Kent are now more than 10 times the average yearly income in the UK, which currently stands at around £31,000 a year.

This is slightly lower than the UK on average, clocking in at an increase of 10.2 per cent across the same period according to figures from the ONS.

This is the highest annual growth rate the UK has seen since August 2007, before the infamous ‘credit crunch’ financial crisis.

Early 2020 saw the housing market grind to a halt – as the first lockdown starting in late March closed estate agents and banned viewings.

Once things reopened, the UK’s average house price growth accelerated rapidly.

Th ONS said the pandemic may have caused house buyers to reassess their housing preferences.

The average price of detached properties increased by 11.7 per cent in the year to March 2021, in comparison flats and maisonettes rose by 5.0 per cent over the same period.

Here is the detailed breakdown of house prices across Kent.

Read about the UK Housing Market via our Specialist Residential & Buy to Let Division

heading {“level”:3} –>

Change in house prices from March 2020 to March 2021

From left to right, the statistics are as follows: District, average house price in March 2020, average in March 2021, price growth in £, price growth in percentages

Tunbridge Wells // £377,298 // £417,066 // £39,768 // 10.5%

Folkestone and Hythe // £259,585 // £293,076 // £33,491 // 12.9%

Thanet // £233,513 // £265,517 // £32,004 // 13.7%

Canterbury // £296,522 // £328,203 // £31,681 // 10.7%

Dover // £247,252 // £275,797 // £28,545 // 11.5%

Dartford // £296,658 // £324,905 // £28,247 // 9.5%

Kent // £291,604 // £317,251 // £25,647 // 8.8%

Sevenoaks // £438,933 // £463,573 // £24,640 // 5.6%

Tonbridge and Malling // £366,893 // £390,617 // £23,724 // 6.5%

Maidstone // £285,672 // £307,072 // £21,400 // 7.5%

Medway // £239,359 // £258,787 // £19,428 // 8.1%

Ashford // £295,451 // £312,957 // £17,506 // 5.9%

Swale // £240,915 // £256,208 // £15,293 // 6.3%

Gravesham // £280,197 // £290,077 // £9,880 // 3.5%

By Claire Miller and Harry Higginson

Source: Kent Live

Discover our Mortgage Broker services.

Intermediary confidence in the mortgage sector returns to pre-pandemic levels

Marketing No Comments

Intermediary’s confidence in the mortgage industry has returned to pre-pandemic levels as businesses experience a rise in the number of cases being handled. This is according to a new report […]

Read More

Intermediary’s confidence in the mortgage industry has returned to pre-pandemic levels as businesses experience a rise in the number of cases being handled.

This is according to a new report by the Intermediary Mortgage Lenders Association (IMLA) which has quizzed brokers on their outlook during the first three months of 2021.

The trade association’s latest research recorded a 14% increase in the average annual number of cases handled by intermediaries between Q4 2020 (78) and Q1 2021 (89).

It means 96% of intermediaries are now confident about the future of the mortgage industry. A further 97% reported being confident about the intermediary sector and 99% saw a positive outlook for their own business.

It comes as the latest data from the Bank of England showed gross lending on all mortgages increased to £81.1 billion from £74.6 in Q4 2020.

To find out more about how we can assist you with your Mortgage requirements, please click here to get in touch

Conversion rates

In Q1 IMLA reported the business mix – the proportion of cases relating to different mortgage types – remained stable.

Two thirds (66%) of cases handled by advisers were for residential mortgages, a further 28% related to buy-to-let customers, and 6% were specialist.

However, the average number of DIPs processed by advisers increased from 25 to 28 between the final three months of 2020 and Q1 2021.

The conversion rate from DIP to completion also increased quarter-on-quarter with 43% in Q1 21 compared to 34% in Q4 20.

After a significant drop in the wake of the coronavirus crisis, the conversion rate from offer to completion increased dramatically from 65% in Q4 2020 to 75% in Q1 2021.

Read about the UK Housing Market via our Specialist Residential & Buy to Let Division

The latest results show that almost two thirds of all applications resulted in a completion between January and March 2021. In Q1 2021, the rate reached 64%, compared to 68% in Q1 2020.

Kate Davies, executive director, IMLA said: “Following a difficult period in the wake of the coronavirus crisis which led to the temporary closure of the housing market, it is pleasing to see such a positive start to 2021.

“Our findings show that after a steady period of recovery, adviser activity levels and sentiment towards the outlook for the sector are now nearing levels not seen since before the start of the pandemic.

“We also expect this high demand to continue into the year, with a combination of Government support helping to underpin new purchases and a bumper year for product maturities also providing significant opportunity in the refinance market.”

Source: Mortgage Finance Gazette

Discover our Mortgage Broker services.
London houses now average £500,000, as UK-wide prices rise at fastest rate in 14 years

Marketing No Comments

UK house prices surged at their fastest rate in almost 14 years over the past year, while London houses remained the priciest of any region despite the lowest annual growth. […]

Read More

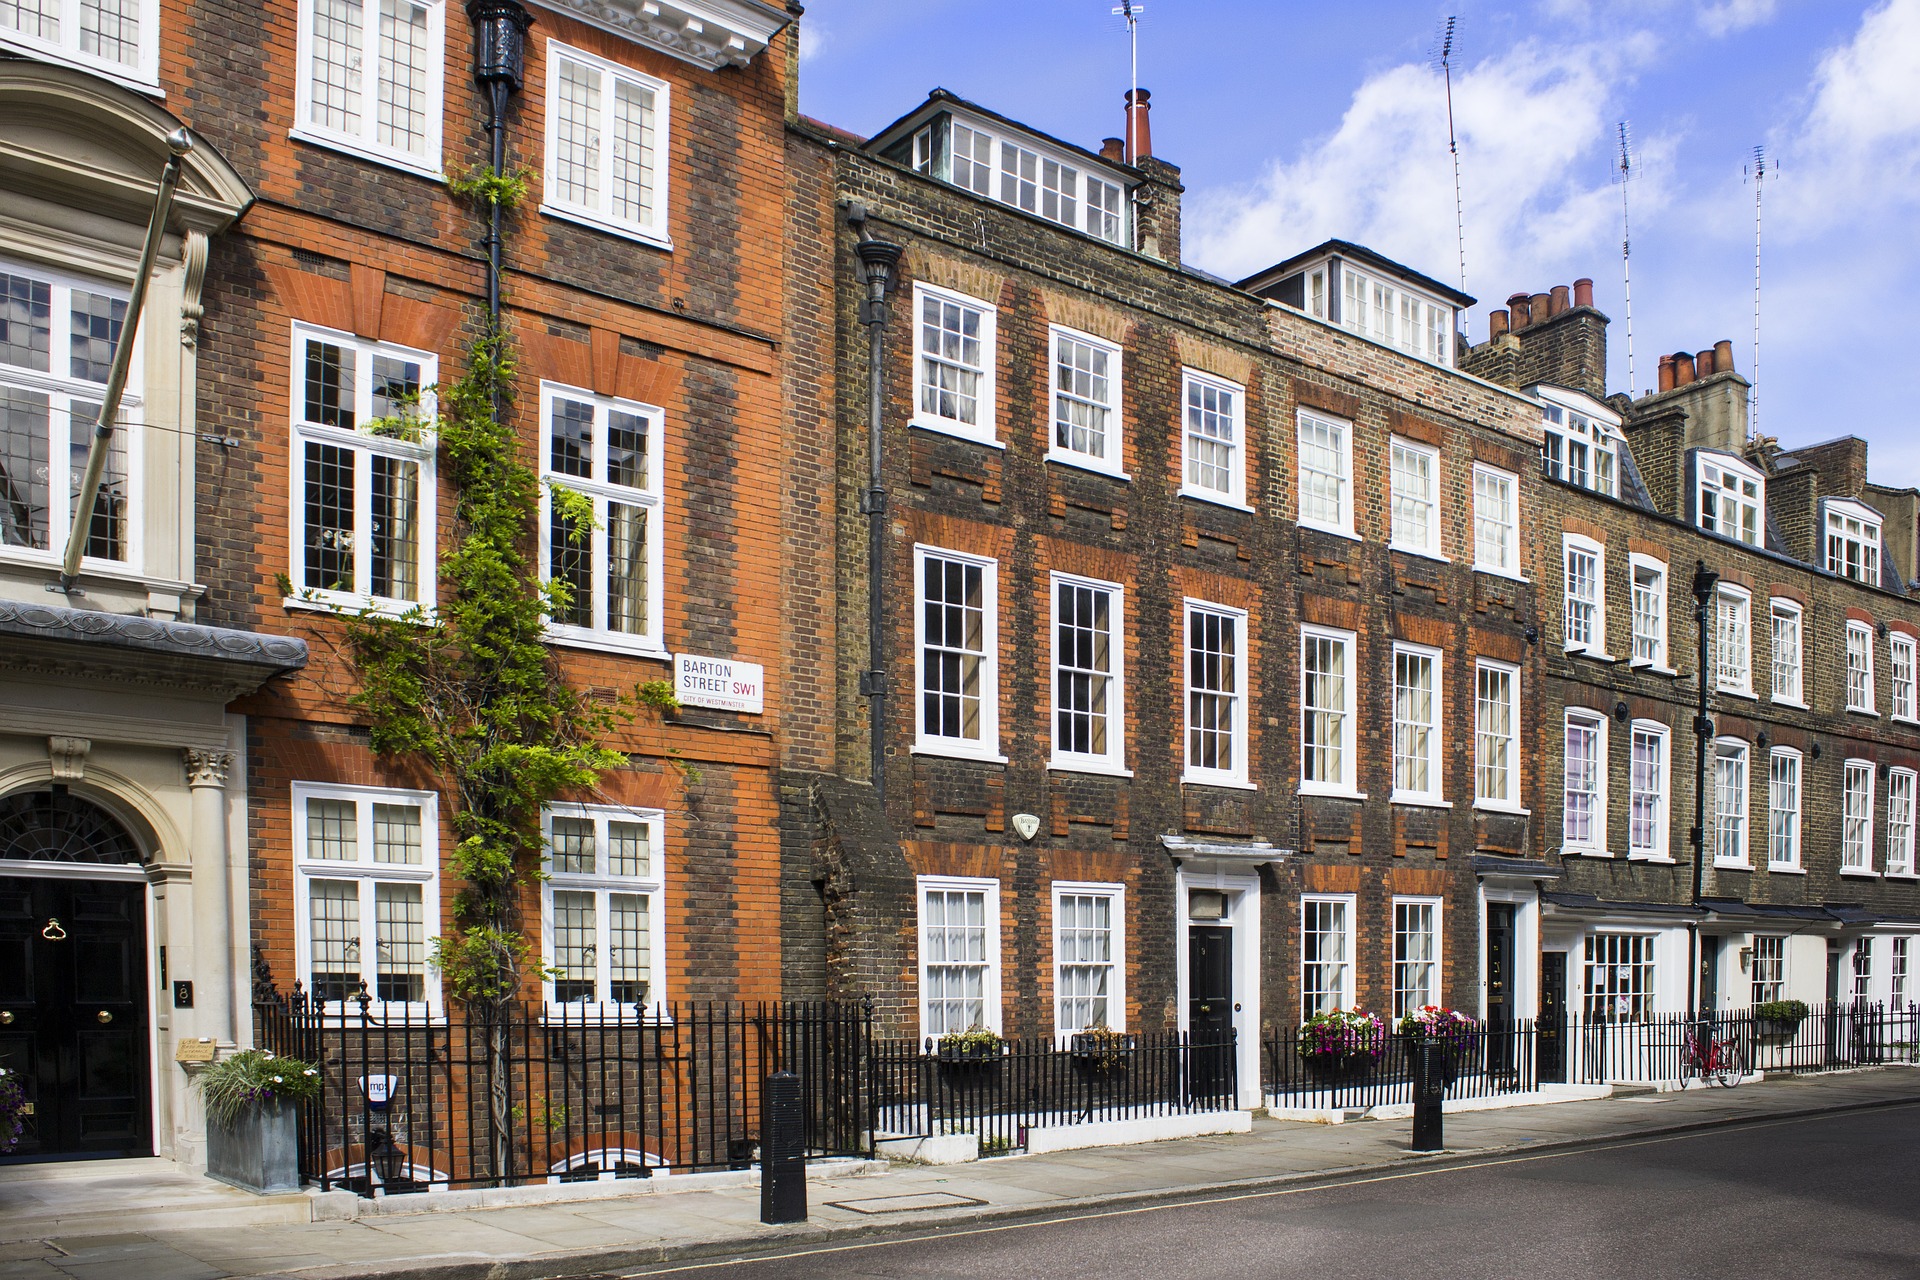
UK house prices surged at their fastest rate in almost 14 years over the past year, while London houses remained the priciest of any region despite the lowest annual growth.

Stoked by the extended stamp duty holiday, the capital’s house prices at an average of £500,000 were the most expensive of any region in the UK in the year to March – but saw annual growth of just 3.7 per cent.

The latest figures from the Office for National Statistics (ONS) showed that prices grew at an annual rate of 10.2 per cent in March, the highest since August 2007, around the same time as the last recession.

However, the increase was up from the 9.2 per cent annual rise observed in February.

Meanwhile, the average price for a house in the UK now sits at around £256,000 – £24,000 higher than in the same month last year.

The stamp duty holiday had prompted sellers to demand higher asking prices, ONS suggested, as buyers’ overall costs had been slimmed down.

To find out more about how we can assist you with your Mortgage requirements, please click here to get in touch

“Whilst this will provide comfort to those lucky enough to own their own home, for those aspiring to buy their first home, the first rung of the property ladder has just got a little further out of reach,” CEO of online property platform Twindig, Anthony Codling, said.

‘Reassessing needs‘

Multiple national lockdowns have spurred many homeowners and potential buyers to revaluate their needs when it comes to house buying, chief economic advisor to the EY ITEM Club, Howard Archer noted.

“Nationwide has said that behavioural shifts may also be boosting activity, as people reassess their housing needs and preferences as a result of lockdown.

“It appears that an increasing number of people want a garden and also space to work at home. This is leading to some polarisation in demand for residential properties.”

Nick Leeming agreed, adding that office space for hybrid working and access to nature has been crucial to homebuyers.

“Today’s house price data provides a clear indication of how much the pandemic has shifted the property market over the past 12 months.

“Our branches in quintessentially English country-side towns such Chichester, Taunton and Chipping Campden continue to see the highest number of new applications, alongside London’s prime commuter-belt towns, including Sevenoaks, Dorking and Cranbrook.

Read about the UK Housing Market via our Specialist Residential & Buy to Let Division

“In London, buyers are paying £20,000 more than they were before the pandemic.”

As we, hopefully, leave lockdowns behind towards the end of the year and the market waves goodbye to the stamp duty holiday, house prices may level out Archer added.

“The EY ITEM Club suspects house prices will lose momentum again later on this year and could well be flat year-on-year by early 2022 with some quarters of falling prices.

“This will be down to the stamp duty benefit ending, unemployment rising and a waning of pent-up demand.”

Leeming continued: “While the extent of current demand may continue to fuel the market for some time yet, it can’t be sustainable forever.

“I would suggest that anyone considering selling their home to do so now while the market conditions are so favourable and there is still room for further price growth.”

Mortgage guarantee

The government’s mortgage guarantee programme also played a part in the inflated prices, aimed at new-buyers, Nick Barnes said.

“There was also an element of anticipation for the imminent introduction of the government’s new mortgage guarantee scheme. Non-resident buyers had the additional incentive to beat the deadline for the introduction of the 2 per cent stamp duty surcharge from the beginning of April.”

The programme may have sparked more market interest in recent weeks, following reduced mortgage approvals this year, as Archer highlighted: “The Bank of England reported that mortgage approvals for house purchases fell back to an eight-month low of 82,735 in March from 87,385 in February.”

By Millie Turner

Source: City AM

Discover our Mortgage Broker services.

Brokers warn of buy-to-let issues with new fire safety law

Marketing No Comments

Mortgage brokers have warned of difficulties for buy-to-let landlords in selling and remortgaging flats, after a majority in the House of Lords voted against an amendment to the new Fire […]

Read More

Mortgage brokers have warned of difficulties for buy-to-let landlords in selling and remortgaging flats, after a majority in the House of Lords voted against an amendment to the new Fire Safety Act.

The amendment sought to prohibit tenants and leaseholders from being liable for the remedial costs of meeting fire safety requirements if they exceeded £500, until a statutory scheme is implemented.

MPs disagreed to four versions of the amendment, as the issue of remediation costs was “too complex to be dealt with in the manner proposed” by the Lords.

The act, which clarifies where responsibility for fire safety lies in multi-occupied buildings in England and Wales, became law last week.

Amid a ban on evictions, which is currently due to end on May 31, brokers have warned that without this amendment, the act will prevent buy-to-let landlords from refinancing – particularly if they are leaseholders in a block of flats.

To find out more about how we can assist you with your Mortgage requirements, please click here to get in touch

Hiten Ganatra said this was particularly due to the fact many lenders now insist on an EWS1 form, which is an industry-agreed way for a building owner to confirm that an external wall system on residential buildings has been assessed for safety by a suitable expert.

Ganatra said: “This is an incredibly delicate situation, which will negatively impact many buy-to-let landlords who have invested in flats, especially if these landlords are already facing financial challenges from non-paying tenants as a result of the Covid eviction ban.”

He added: “Their investments could become unsellable and the problem could be exacerbated even further with tenants being worried about moving into flats in the absence of having confirmation that remedial works have been completed.

“This could also severely hinder buy-to-let landlords’ ability to refinance, as most buy-to-let lenders are insisting on EWS1 forms giving the building a clean bill of health, before allowing the mortgage to go through.”

Dominik Lipnicki questioned the fairness of buy-to-let landlords potentially being required to cover remedial costs of any affected leasehold properties.

Discover our Buy to Let Mortgage Broker services.

Lipnicki said: “How can it be right that innocent buy-to-let landlords who have invested in leasehold properties will now be responsible for a huge potential liability to correct fire and safety issues that they were simply unaware of, rendering many of these properties unsellable and impossible to remortgage?”

In February the government announced it would fully fund the cost of replacing unsafe cladding for all leaseholders in residential buildings in England that are at least 18m high.

Meanwhile, a scheme was announced to enable leaseholders of lower-rise buildings (between 11m and 18m) to pay for any necessary cladding removal through a long-term, low interest, government-backed financing arrangement.

But in a report published last week (April 29) the Housing, Communities and Local Government Committee said proposals to fund cladding remediation on buildings below 18m through a loan scheme should be “abandoned”.

It called for an “enhanced” fund open to all buildings with existing fire safety issues, without barriers based on height, types of tenure or the nature of fire safety defects.

By Chloe Cheung

Source: FT Adviser

Discover our Mortgage Broker services.

Most profitable locations for buy-to-let landlords revealed

Marketing No Comments

Brighton, Bangor, Portsmouth and Leeds are the top places for buy-to-let landlords, research from CIA Landlords has revealed. Ranked at the bottom of the table is St Albans, with the […]

Read More

Brighton, Bangor, Portsmouth and Leeds are the top places for buy-to-let landlords, research from CIA Landlords has revealed.

Ranked at the bottom of the table is St Albans, with the poorest prospects for landlords this year, with some potentially making a loss of more than £700 a month.

Only six locations in London remain profitable, with the majority of boroughs losing money.

The research also reveals that profitability in the Capital has nearly halved since January 2020, amid a major exodus during the pandemic.

To find out more about how we can assist you with your Mortgage requirements, please click here to get in touch

Brighton remains the most profitable place to be a landlord for the second year running, with landlords in the coastal town making a monthly profit of around £570.

The findings, which took into account rental fees charged to tenants and landlord costs placed Bangor in second place (£500.53), Portsmouth in third place (£479.27), Leeds in fourth place (£477.60) and Lancaster in fifth (£474.54).

Bristol, Coventry, Manchester, Nottingham and Salford rounded out the top ten.

Stuart Williams (pictured), director of Thirlmere Deacon, said: “Over the last few months, some landlords have seen their profits dented due to the Chancellors’ tax measures that are only now taking effect.

“Undoubtedly, it is becoming more difficult for amateur investors to make a profit in the buy-to-let market due to legislation changes and financial pressures, there is still a lot of money to be made if landlords and investors make the right investment decisions.

“If investors can purchase cheaper properties with higher yields, they will have the opportunity to protect and boost their profits in the longer term. For example, an average residential property in London is around £500k with rental yields of circa 2%, while a flat in a good area of Manchester could cost half the price and generate 6-7% rental yields on top of 4-5% annual capital appreciation.

Discover our Buy to Let Mortgage Broker services.

“Landlords should review their existing portfolio to see if they can boost rental income and protect profits, by attracting a different market. Landlords will often find the best returns in urban areas, with a concentration of students and young professionals.

“It is also worth landlords considering setting up a limited company and using this structure to hold their properties.

“This will enable them to continue deducting mortgage interest when they are calculating profits. Landlords can also benefit from just 20% corporation tax, instead of income tax of up to 45%.

“Landlords need to do a serious portfolio review and work out how the tax changes affect them and what options there are to save, or make more money. For example, remortgaging to get a better deal or renovating some old stock – these costs will be tax-deductible.

“Alternatively, landlords could consider selling some properties or increasing the rent.”

By Ryan Fowler

Source: https://uk-mortgagebroker.co.uk/news/

Discover our Mortgage Broker services.
Super-prime tenancies rebound in the second half of 2020

Marketing No Comments

Super-prime tenancies, that’s tenancies with a £5k+ pw rent, have seen a resurgence during the COVID-19 pandemic with the period between July and December 2020 being the most active in […]

Read More

Super-prime tenancies, that’s tenancies with a £5k+ pw rent, have seen a resurgence during the COVID-19 pandemic with the period between July and December 2020 being the most active in the past seven years.

In total there were 137 such tenancies taken out in London during 2020 – this was down 11% on the 154 taken out in 2019. However, following the onset of the pandemic this changed with 87 tenancies agreed in the last six months of the year.

To find out more about how we can assist you with your Mortgage requirements, please click here to get in touch

It underlines how demand has not been dented by the pandemic, according to Tom Smith, head of super-prime lettings at Knight Frank.

He said: “A big driver in recent years has been the rates of stamp duty in the sales market and it is still a big motivation for tenants.

“That rationale is still there and will arguably grow with the extra 2% surcharge that overseas buyers will have to pay from April.”

Read about the UK Housing Market via our Specialist Residential & Buy to Let Division

However the market is now being hit with a lack of supply in areas such as Chelsea, Notting Hill and St Johns Wood.

Smith said that this may improve in the coming weeks as lockdown restrictions continue to ease.

He added: “We are now having conversations with owners who say they would be open to either a sale or a letting and some strong offers are coming through in the sales market now.”

By Ryan Fowler

Source: https://uk-mortgagebroker.co.uk/news/

Discover our Mortgage Broker services.

Value of BTL portfolio rises despite drop in landlord numbers

Marketing No Comments

The latest figures by estate agent Barrow and Forrester show that despite the number of landlords operating in the buy-to-let sector dropping by 8% in two years, the value of […]

Read More

The latest figures by estate agent Barrow and Forrester show that despite the number of landlords operating in the buy-to-let sector dropping by 8% in two years, the value of the average BTL portfolio has risen by almost £40,000 in the past 12 months.

Across Britain, the average landlord’s buy-to-let portfolio consists of 1.9 properties and with the current average house price sitting at £254,525, it equates to an estimated value of £491,234.

This is an increase of £38,820 in the value of their buy-to-let portfolio in one year.

The South West has seen the most considerable uplift in portfolio value with an increase of £49,000 in the past year.

The East Midlands has also seen a notable jump of £41,000 in value, with the East (+£38,000) South East (+£37,000) and West Midlands (+£36,000) also climbing considerably.

London still leads in terms of the most valuable landlord portfolios.

To find out more about how we can assist you with your Mortgage requirements, please click here to get in touch

With the average landlord owning two properties in the capital, the total value of their property investment is almost £1m having climbed by £34,000 in the last year.

The South East has not only seen one of the largest annual increases in portfolio value, but at £641,093, landlords in the region are also seeing the second-highest total sum.

The East (£575,187), South West (£530,890) and East Midlands (£427,942) are also home to some of the highest buy-to-let portfolios per landlord.

James Forrester, managing director of Barrows and Forrester, said: “A sharp increase in property values brought on due to the current stamp duty holiday has caused a considerable jump in the value of BTL investment portfolio up and down the nation.

“However, true to form, it seems as though the government will do their best to spoil the party with an increase in capital gains tax via next month’s budget.

Discover our Buy to Let Mortgage Broker services.

“This is quite astounding given the string of changes already implemented to stamp duty tax thresholds and tax relief and the impact it has had on landlord numbers.

“They don’t seem to understand that the BTL sector is the backbone of the rental market and fewer landlords means fewer properties and even less affordable rents.

“Who will provide the much needed rental accommodation if not the buy-to-let sector?

“Because it certainly won’t be the government, who have proved time and time again that they’re incapable of implementing any meaningful strategy where the delivery of property market stock is concerned.”

By Jessica Nangle

Source: https://uk-mortgagebroker.co.uk/news/

Discover our Mortgage Broker services.

Mortgage lenders back possessions moratorium

Marketing No Comments

Mortgage lenders have backed the Financial Conduct Authority’s extension to the moratorium on possessions to 1 April 2021. This followed the government’s extension of the moratorium on private tenant evictions […]

Read More

Mortgage lenders have backed the Financial Conduct Authority’s extension to the moratorium on possessions to 1 April 2021.

This followed the government’s extension of the moratorium on private tenant evictions until 21 February 2021 in England. Wales and Scotland have banned rental evictions until 31 March 2021.

Eric Leenders, managing director of personal finance at UK Finance, said: “The banking and finance industry is committed to providing ongoing support to those facing financial difficulty as a result of the pandemic.

To find out more about how we can assist you with your Mortgage requirements, please click here to get in touch

“The industry is fully supportive of a moratorium on possessions remaining in place until 1 April 2021 to ensure customers do not lose their home at this difficult time.

“This is part of a package of support provided by lenders for those who need it, including payment deferrals and tailored assistance.

“It is vital that customers who are concerned about their finances go online or contact their lender to understand what options and support are available to them.”

Read about the UK Housing Market via our Specialist Residential & Buy to Let Division

Under the extension, members of UK Finance and the Building Societies Association will agree not to seek, or enforce, a warrant for possession before 1 April 2021, unless there are exceptional circumstances such as a customer requesting proceedings to continue or when the property is in vacant measures.

This latest extension means the measures will have been in effect for 12 months by its end date.

BY RYAN BEMBRIDGE

Source: Property Wire

Discover our Mortgage Broker services.